
Client teams needed a centralized dashboard to track UWA performance and business impact for the Package Team. Leadership, data stakeholders, and operation managers lacked a unified way to monitor submission volumes, underwriter activity, cycle times, incidents, and prioritization across Lines of Business. I was tasked with designing a multi-screen dashboard from scratch that would meet both analytical and business needs.
• Collaborated closely with cross functional stakeholders including GenAi Product Analyst, Product Owner, Product Manager, Chief Data Officer, and Business Manager.
• Proposed and led weekly working sessions to review progres, gather feedback, and refine dashboard requirements.
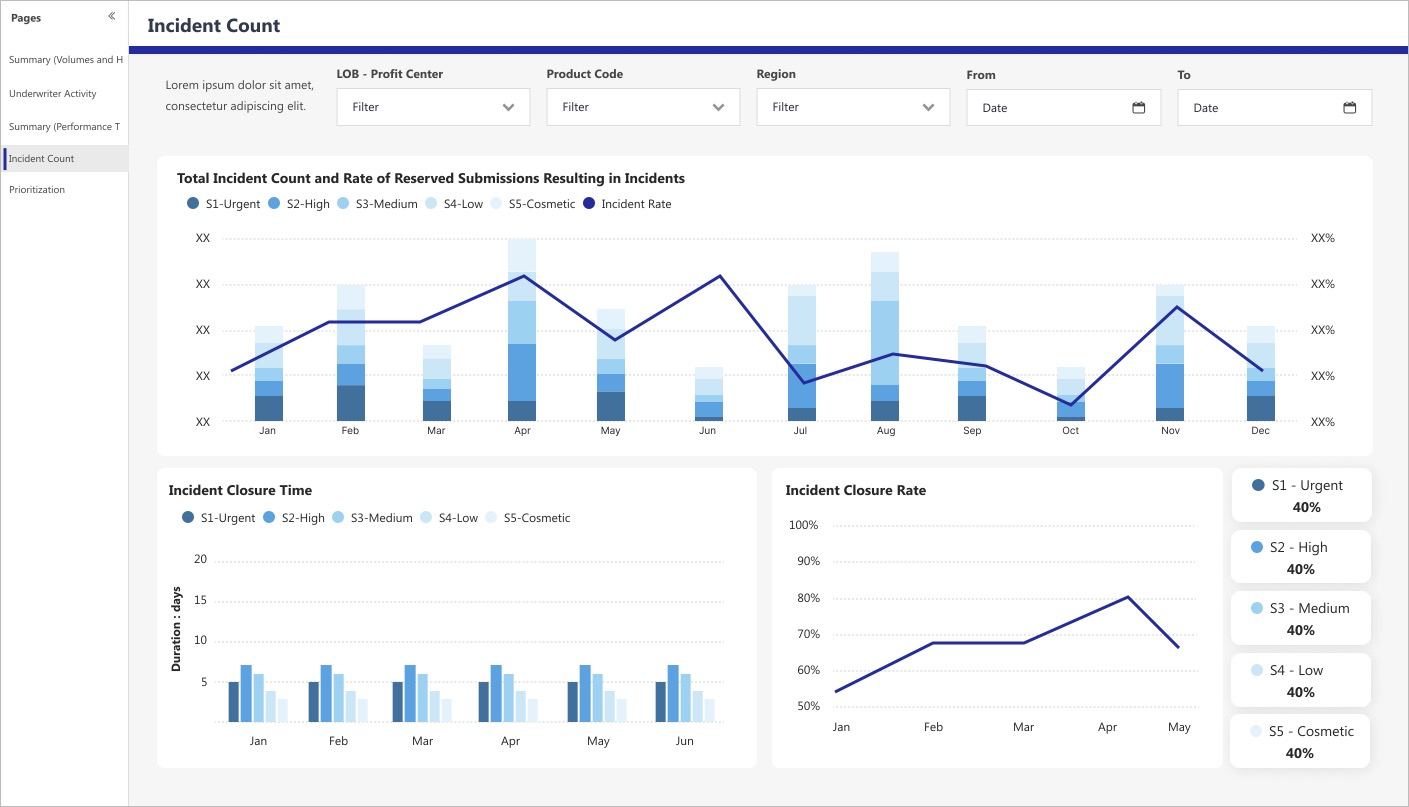
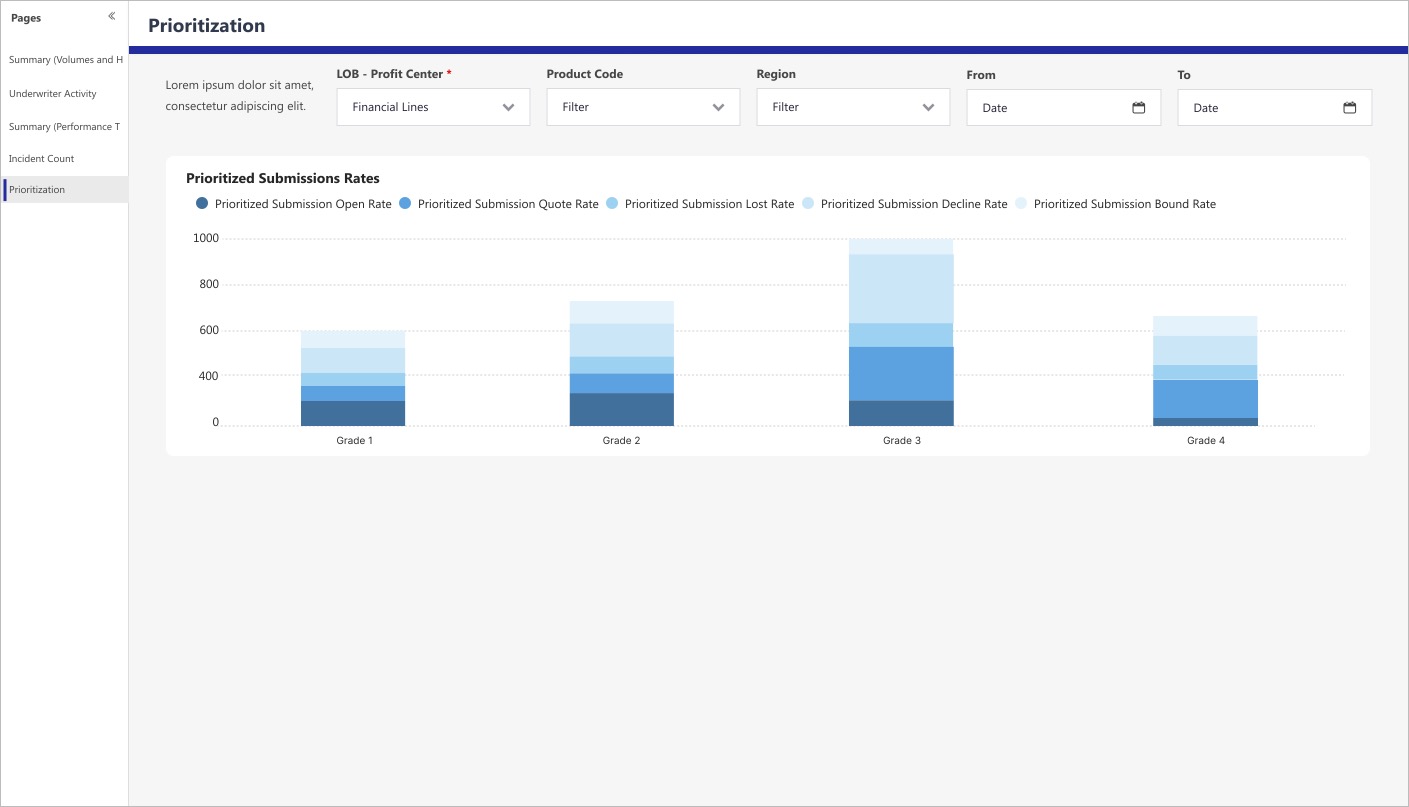
• Designed a 5-screen dashboard using Power BI with AIG brand guidelines for consistency and credibility.
• Structured navigation with clear tabs (Summary, Underwriter Activity, Performance Time, Incident Count, Prioritization) for intuitive access to metrics.
%202.jpg)
-1.jpg)
-2.jpg)
• Delivered a scalable and visually cohesive dashboard that became a single source of truth for monitoring UWA performance.
• Empowered leadership and operation teams with actionable insights into underwriter activity, efficiency, and incident management.
• Reduced time spent gathering reports by providing real time, interactive visualizations.
• Improved data transparency and alignment across stakeholders by consolidating previously siloed reporting metrics.
• Positioned the dashboard as a decision-making tool to guide resource allocation, operational improvements, and business strategy.
If you like what you see and want to work together, get in touch!
samiraowens@yahoo.com